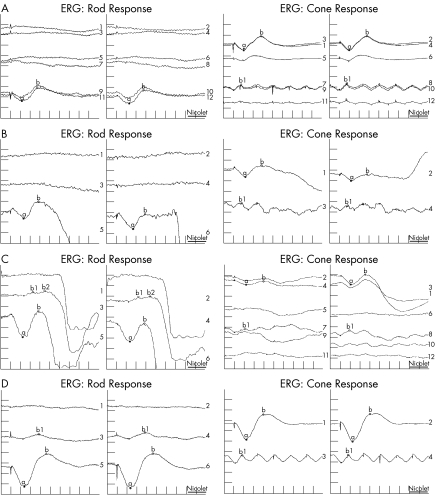
Figure 2 The electroretinograms (ERGs) of (A) case 1, (B) her mother, (C) case 2 and (D) case 3 were diagnostic for enhanced S‐cone syndrome (ESCS)—a similar, simplified and delayed waveform response to flash under photopic and scotopic conditions; and a delayed 30‐Hz flicker amplitude lower than that of the photopic a‐wave. The left tracings of each column are for the left eye and right tracings for the right eye. Stimulus intensities are described in logarithmic (log) units relative to the standard stimulus (1.5–3 Candela seconds/m2 at the surface of the Ganzfeld bowl). For each ERG in the first column (Rod Response), top tracings are for a minimal (0.25 log units) blue (430 nm) stimulus, middle tracings are for a standard (1.0 log unit) red (644 nm) stimulus, and bottom tracings are for a maximal (1.5 log units) white flash. Repeat recordings are seen in (A). In the second column (cone response), for the tracings in (A) and (C), the top tracings are for maximal flash with low background illumination (1 foot Lamberts), the middle tracings for standard flash with high background illumination (30 foot Lamberts), the second to last tracings are for maximal intensity flicker (30 Hz) with low background illumination, and the bottom tracings are for standard intensity flicker with low background illumination. Repeat recordings are seen for these tracings. In the second column for the tracings in (B) and (D), the top tracings are for maximal flash with low background illumination and the bottom tracings are for maximal intensity flicker with low background illumination; no repeats were done.

An official website of the United States government
Here's how you know
Official websites use .gov
A
.gov website belongs to an official
government organization in the United States.
Secure .gov websites use HTTPS
A lock (
) or https:// means you've safely
connected to the .gov website. Share sensitive
information only on official, secure websites.
