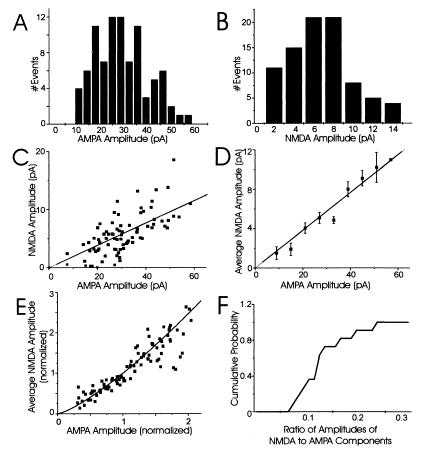
Figure 2.
Both AMPA and NMDA components of mEPSCs at putative single synapses are highly variable and strongly correlated. (A) Amplitude histogram of the AMPA component of all mEPSCs recorded from a single synapse (CV = 0.42; cell 1 in Table 1). (B) Amplitude histogram of the NMDA component of all mEPSCs recorded from the same single synapse (CV = 0.65). (C) A representative example of the relationship between AMPA and NMDA components at a single synapse. Each point corresponds to a single, dual-component mEPSC. The best-fit linear regression through zero is plotted for reference. (D) To determine the average correlation of the two components, the average NMDA amplitude was plotted for all mEPSCs with AMPA amplitudes within 10 bins of 6 pA (error bars are 1 SEM); the line through zero is the best-fit linear regression. The AMPA and NMDA components were highly correlated at this synapse (correlation coefficient = 0.72). (E) To compare mEPSC amplitudes from all 11 single synapses, the AMPA and NMDA components at each synapse were normalized relative to their mean amplitudes. The normalized, average NMDA amplitude for mEPSCs at each individual synapse then was plotted relative to the normalized AMPA amplitude and the best-fit linear regression constrained through zero was included for reference. (F) A cumulative probability histogram of the ratio of amplitudes of NMDA to AMPA components.

