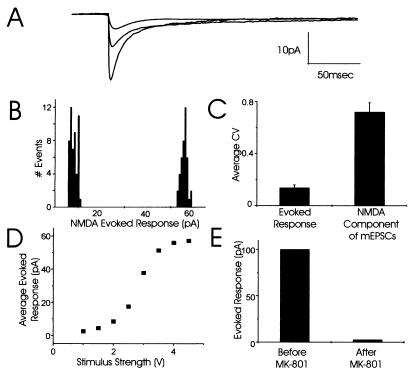
Figure 4.
Postsynaptic responses to iontophoretic application of NMDA show very little trial-to-trial variability. (A) Families of currents at three stimulus strengths illustrate the consistency of responses to fixed NMDA concentrations. Each family contains three individual traces. (B) Amplitude histograms show little variability in amplitude of NMDAR-mediated responses to minimal and maximal stimulus strengths for NMDA iontophoresis. (C) Pooled data for the CV of currents evoked by NMDA iontophoresis (CV = 0.18; three separate experiments) compared with the CV for the NMDA component of mEPSCs recorded at single synapses (CV = 0.73; average of all 11 synapses). (D) The maximal amplitude of the average evoked response (pA) to increasing concentrations of iontophoretically applied NMDA at this synapse plateaued at approximately 60 pA. (E) At a separate synapse, the average evoked response to NMDA iontophoresis was approximately 100 pA and was completely abolished by selectively blocking synaptic NMDARs with the open channel blocker, MK-801.

