
Figure 6.
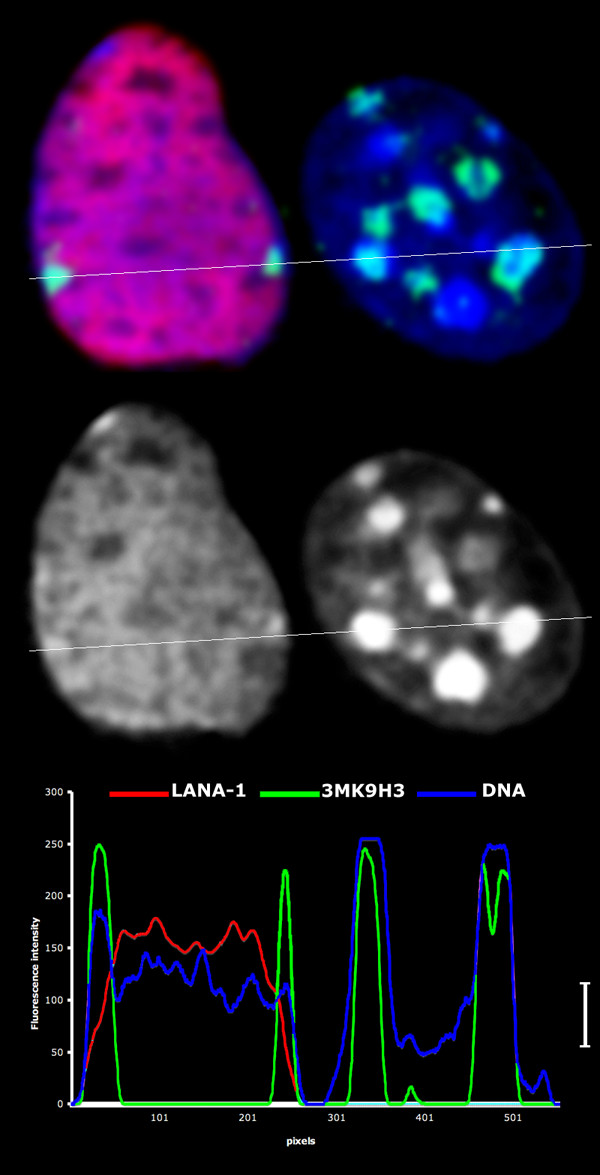
High resolution comparison of LANA-1 (red) positive L-cell nucleus with an adjacent non-transfected cell in a single optical section that slices both nuclei in the middle level. The intensity plot is recorded along the white line and demonstrate a massive release of the bulk DNA (blue) from the chromocenters in the transfected cell without effecting the 3MK9H3 (green) levels in the remnants of the chromocenters (white staple on the right side of the line plot).