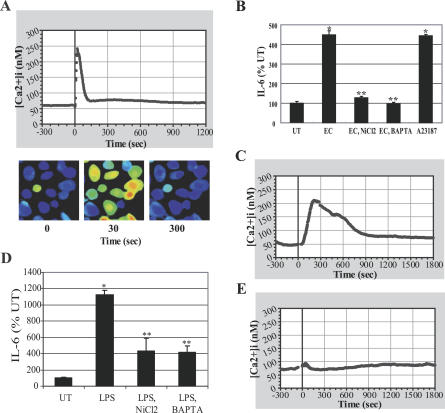
Figure 2. IL-6 Response of BECs to E. coli Is Preceded by an Increase in [Ca2+]i .
(A) [Ca2+]i tracing of BECs before and after E. coli exposure. E. coli was added at time 0.
(B) BEC IL-6 responses after E. coli exposure in the absence or presence of NiCl2 (2 mM) or BAPTA-AM (5 μM), or after calcium ionophore A23187 (1 μM) treatment without bacterial exposure. *, p < 0.001 relative to untreated (UT) BECs; **, p < 0.001 relative to E. coli (EC)–treated BECs.
(C–E) BEC [Ca2+]i tracing before and after purified LPS treatment (C) or PMB pretreated LPS treatment (E). (D) BEC IL-6 responses following exposure to LPS in the absence or presence of NiCl2 or BAPTA-AM. *, p < 0.001 relative to UT BECs; **, p < 0.01 relative to LPS-treated BECs.

