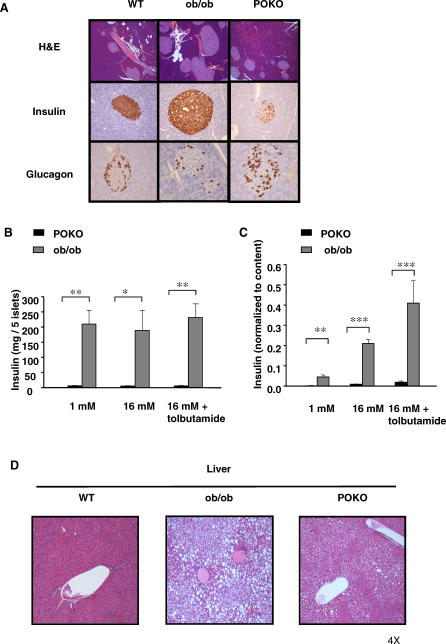
Figure 3. Impaired β-Cell Function and Hepatic Morphological Analyis in the POKO Mice.
(A) H and E-stained sections (10×) and immunohistochemical (20×) analysis of insulin and glucagon in pancreas from 16-wk-old males WT, ob/ob, and POKO mice (n = 5).
(B) Insulin content of islets isolated from POKO (black bars), and ob/ob (grey bars) mice. Each data point is the mean of six samples each of five islets.
(C) Insulin secretion from islets isolated from POKO (black bars) and ob/ob (grey bars) mice in response to glucose (1, 16 mM) or glucose 16 mM + tolbutamide (200 μM). Data were collected from six samples each of five islets from three mice of each genotype. For each sample, insulin release was normalised to insulin content. *, p < 0.05; **, p < 0.01; ***, p < 0.001 POKO versus ob/ob.
(D) H and E-stained sections (4×) in liver from 16-wk-old males WT, ob/ob, and POKO mice (n = 5).

