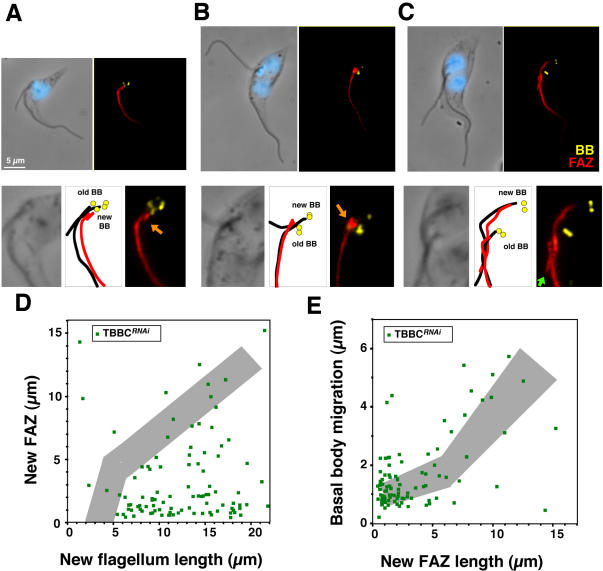
Figure 6. FAZ formation and basal body migration are severely perturbed in the absence of flagella connection.
A–C. Top panels: Double labelling of TBBCRNAi detergent-extracted cells induced for 72 h stained with MAb22 (basal body marker [BB], yellow), L3B2 (FAZ marker, red) and DAPI (blue). Bottom panels: 2-fold magnification of the basal body area of the above images. Diagrams show the position of the old and new basal bodies, as well as positioning of the flagellum (black lines) and the FAZ filament (red lines). A–B. Cells with a short FAZ in close proximity to the old one (orange arrows) have a very limited basal body migration. C. A rare cell with a longer FAZ and normal basal body migration. Note the absence of contact between the tip of the new FAZ and the old FAZ filament (green arrow). D. FAZ length (measured by using the L3B2 signal) is reduced in the absence of flagella connection. Grey shows the range for controls cells (data from Fig. 2). E. Basal body migration compared to FAZ elongation in the same cells.

