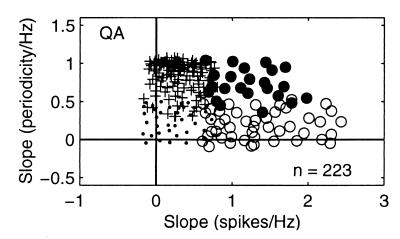
Figure 2.
Response properties of QA neurons of S1 as a function of the stimulus frequency. For each neuron studied during the frequency discrimination task, we calculated the slope of the best linear fit of the periodicity and/or firing rate values as a function of the stimulus frequencies. We required a good fit (χ2, Q > 0.05) and the slope of this linear fit to be significantly different from zero (permutation test, n = 1,000, P < 0.01). Each data point corresponds to the intersection of the slopes of periodicity (y axes) vs. firing rate (x axes). Plotting periodicity vs. firing rate for each neuron studied during the discrimination task gave different clusters of response patterns. Small dots are neurons that did not provide information about the stimulus frequency in terms of both periodicity and firing rate. Pluses are neurons that gave information about the stimulus frequency in periodicity only. Black circles are neurons that provided information about the stimulus frequency in terms of both periodicity and in the firing rate. Open circles are the neurons that provided information about the stimulus frequency in the firing rate only.

