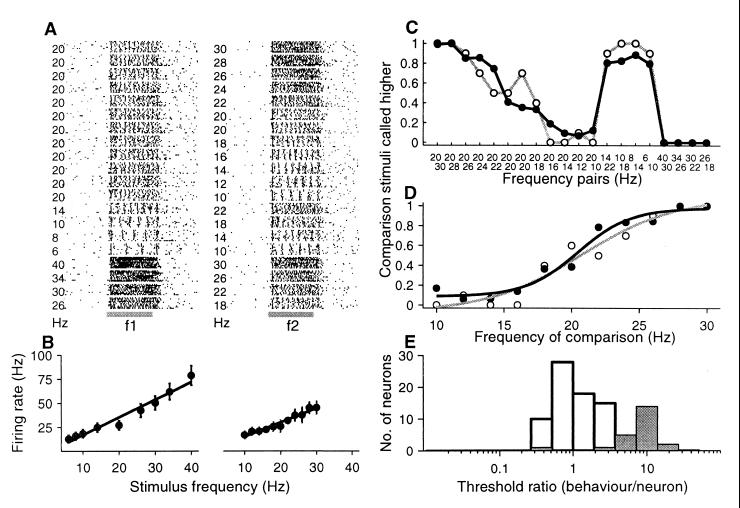
Figure 4.
Firing rate modulation of an area 3b neuron during the discrimination task. Same format as Fig. 3A. (A) Raster plots. (B) Mean rate (± SD) as a function of the stimulus frequency. (C) Relationship between psychometric and neurometric functions. (D) Psychometric and neurometric functions. (E) Threshold ratios calculated between psychometric and neurometric thresholds for each neuron, which varied the firing rate as a function of the stimulus frequency (open bars). Gray bars represent the threshold ratios between psychometric and neurometric thresholds calculated from a small number of neurons that show periodicity.

