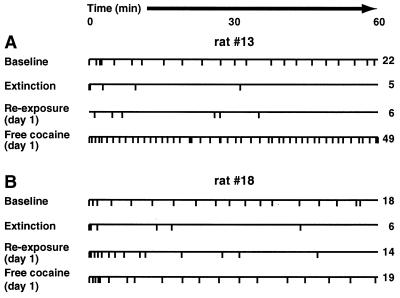
Figure 2.
Reinforcer delivery record for GNC-KLH (A) and KLH (B) groups on four different phases of the relapse study (rats 13 and 18, respectively). Each horizontal line is a time line representing a 60-min cocaine self-administration session. The horizontal axis denotes time, and each vertical mark represents a single cocaine infusion (0.25 mg/infusion). The experimental phase is shown to the left of each line. The number shown to the right of each time line is the total number of infusions delivered during the session.

