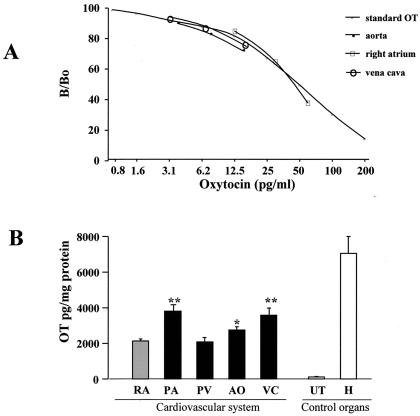
Figure 1.
(A) OT immunoreactivity of serial dilutions (1:80, 1:40, 1:20) of rat extracts form the vena cava and aorta as well as right atrium homogenates measured by RIA. Results are compared with the OT standard curve. The ordinate shows the ratio (expressed as percentage) of bound 125I-labeled OT in the presence (B) and absence (Bo) of synthetic oxytocin. (B) OT concentration in rat tissues obtained by RIA after prior extraction by Vycor heat-inactivated glass beads. OT concentration (mean ± SEM) is compared in right atrium (RA) vs. pulmonary artery (PA), pulmonary vein (PV), aorta (AO), and vena cava (VC). The uterus (UT) and hypothalamus (H) are used as a control organs.

