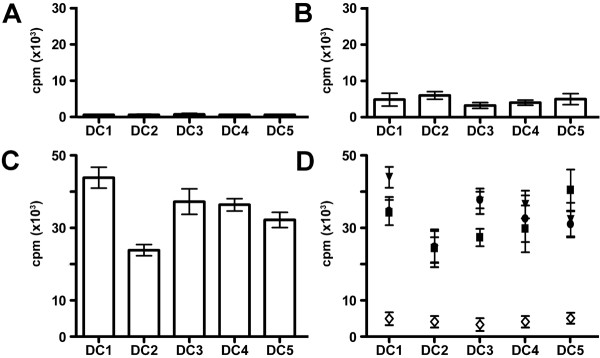
Figure 4.
Analysis of allostimulatory capacity of different DCs in mixed lymphocyte reactions. (A) Negative controls of proliferation of irradiated (40 Gy) DCs alone. (B) Proliferation of autologous T cells stimulated by DC1–DC5 populations. (C) Proliferation of one representative allogeneic T cell responder stimulated by DC1–DC5 cells. Note that the y-axis is different for autologous and allogeneic T cell responses. (D) Summary of proliferation data of three independent allogeneic T cell responders in comparison to autologous T cells stimulated by DC1–DC5 cells.

