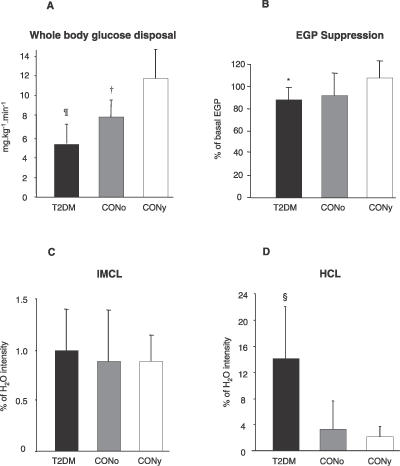
Figure 2. Glucose Metabolism and Intracellular Lipids of Skeletal Muscle and Liver.
Whole-body glucose disposal (A) and ΔEGP (B) during euglycemic–hyperinsulinemic clamp (n = 31). IMCL in skeletal muscle (n = 31) (C) and liver (n = 29) (HCL) (D). Patients with T2DM (black columns), CONo (grey columns), and CONy (white columns). All results are means ± SD. ¶ p < 0.001 T2DM versus CONy; † p < 0.01 CONo versus T2DM and CONy; * p < 0.05 T2DM versus CONy; § p < 0.001 T2DM versus controls.

