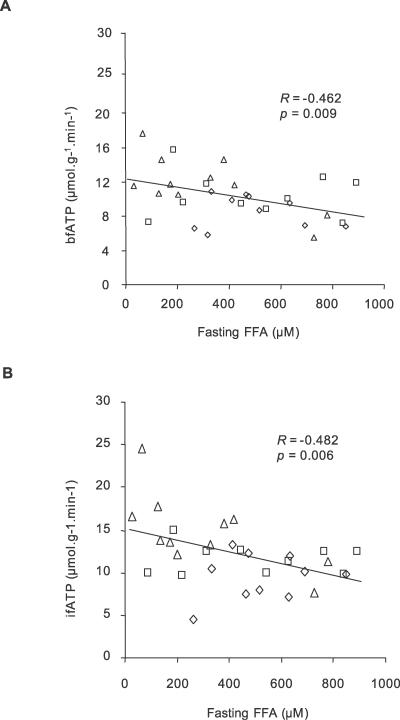
Figure 4. Associations between ATP Synthetic Flux and Metabolic Parameters.
Correlation analyses of rates of ATP synthetic flux (n = 31).
(A) Relation between fasting plasma concentration of FFAs and bfATP across all groups.
(B) Relation between fasting plasma FFAs and ifATP across all groups. Patients with T2DM (n = 10) (diamonds), age- and BMI-matched controls (CONo; n = 10) (squares), and young healthy controls (CONy; n = 11) (triangles).

