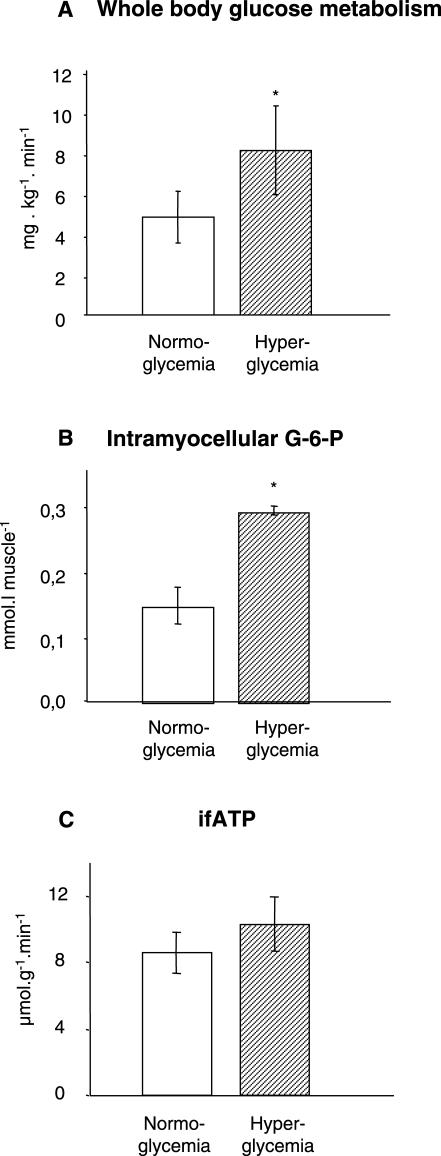
Figure 5. Glucose Metabolism and ATP Synthetic Flux during Hyperglycemic–Hyperinsulinemia in T2DM.
Whole body glucose disposal (A), concentration of intramyocellular G-6-P (B), and ifATP (C) during euglycemic (approximately 5.5 mM glucose)–hyperinsulinemic (approximately 500 pM insulin) (white columns) and hyperglycemic (approximately 9.5 mM glucose)–hyperinsulinemic (approximately 500 pM insulin) clamps (hatched columns) in patients with T2DM (n = 4). * p < 0.05.

