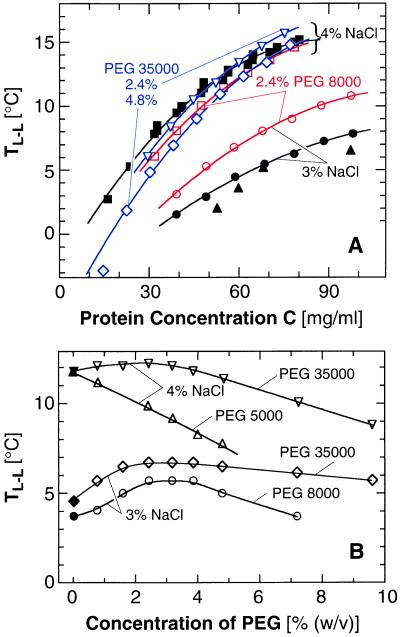
Figure 3.
Effects of PEG with molecular mass and concentration indicated in the plots on the L–L separation in a lysozyme solution containing 3 or 4% (wt/vol) NaCl at pH 4.5 by 50 mM sodium acetate buffer. Closed symbols, no additive; open symbols, PEG added as indicated in the plots. Curves are just guides for the eye. (A) Changes in the L–L separation boundary introduced by the addition of PEG. ▴, data of ref. 4 for 3% (wt/vol) NaCl. (B) Dependence of the L–L separation temperature on the concentration of PEG in a 50 mg/ml lysozyme solution.

