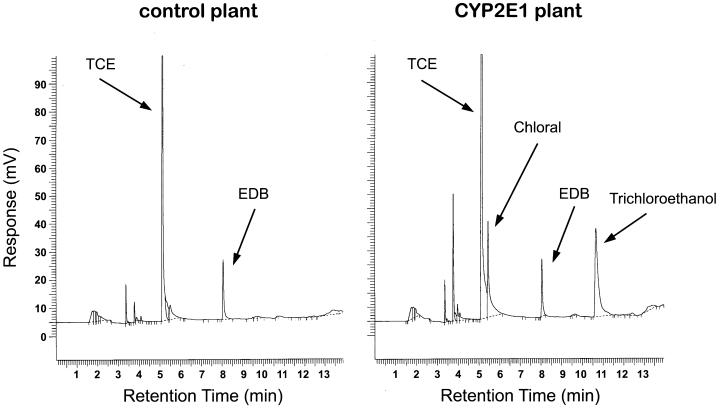
Figure 2.
Gas chromatograph of root extracts from a vector control plant (Left) and from a P450 2E1 plant (Right). The hydroponically grown plants were exposed to 118 μg/ml TCE for 5 days before the tissues were collected, frozen in liquid nitrogen, and processed. Powdered root samples were spiked with equal amounts of EDB to serve as an internal standard. The samples were then extracted with tert-butyl methyl ether and run on a GC-ECD. Peaks representing the internal standard EDB and TCE and its metabolites, chloral and trichloroethanol, are indicated by arrows.

