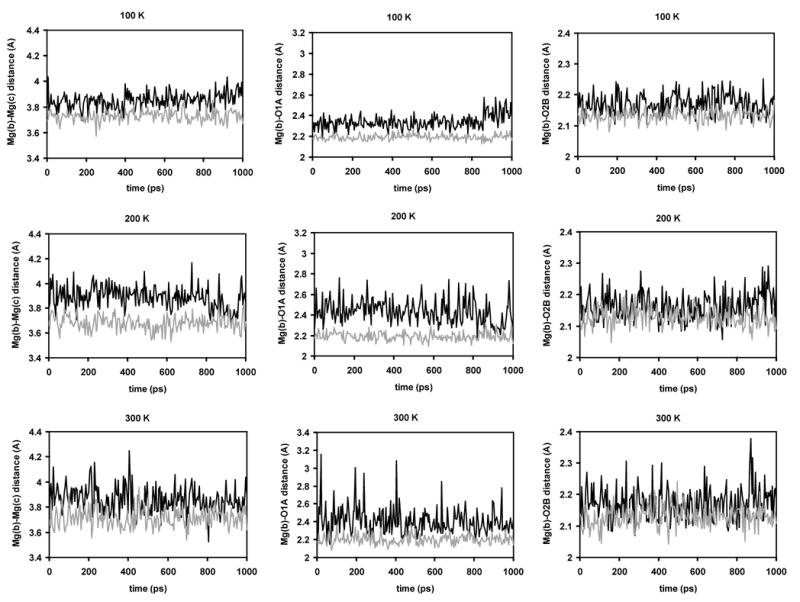
Figure 3.

Critical distances in the active site of the MgMg structure over the course of 1 ns MD simulations at different simulation temperatures (panels A, B, and C: 100 K; panels D, E, and F: 200 K; panels G, H, and I: 300 K) using the regular Mg2+ model (black) and the MD62+ model (grey). Panels A, D, and G show the Mg(b)-Mg(c) distance; panels B, E, and H the Mg(b)-O1A distance; and panels C, F, and I the Mg(b)-O2A distance.
