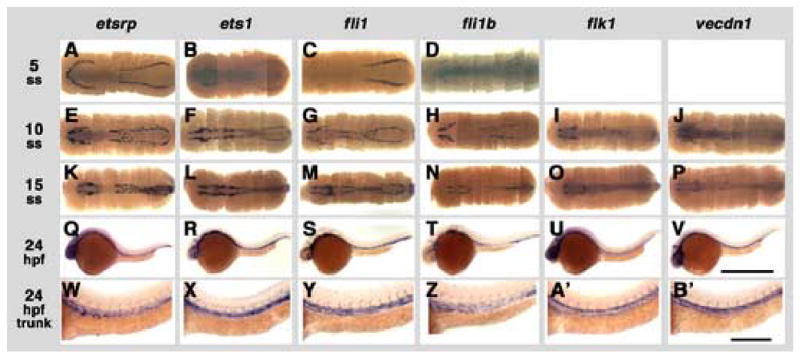
Figure 4.

Expression of zebrafish ETS transcription factors during somitogenesis, with flk1 and vecdn1 shown for comparison. Whole mount in situ hybridization using probes for zebrafish etsrp (A, E, K, Q, W), ets1 (B, F, L, R, X), fli1 (C, G, M, S, Y), fli1b (D, H, N, T, Z), flk1 (I, O, U, A’), and ve-cdn (J, P, V, B’). Embryos are probed at the 5 somite stage (ss)/11.5 hours post-fertilization (hpf) (A–D), 10 ss/14 hpf (E–J), 15 ss/16.5 hpf (K–P), and 24 hours post-fertilization (Q-B’). Images in A–P are complete rostral to caudal collages of multiple dorsal-view images, for a “virtual flat mount.” Images in Q–V are lateral views of the entire 24 hpf animal, while W-B’ are higher magnification lateral views of 24 hpf trunks. Rostral is to the left in all panels, dorsal is up in Q-B’. Scale bars = 1000 μm (A–V), and 250 μm (W–B’).
