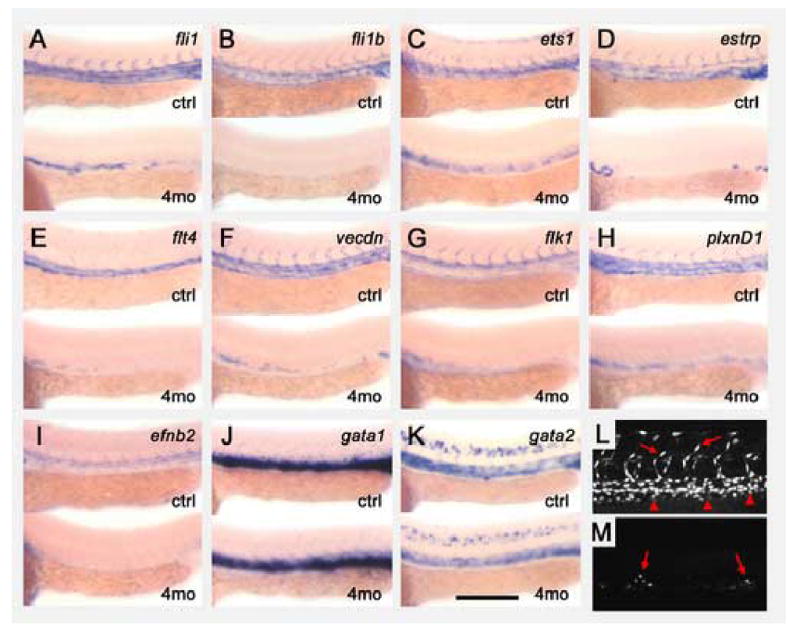
Figure 8.

Reduction of all four vascular ETS transcription factors by morpholino knockdown. (A–K) Expression of ETS transcription factors and vascular and hematopoietic marker genes in animals injected with either a control morpholino (top of each panel) or a cocktail of four morpholinos targeting the fli1, fli1b, ets1, and etsrp genes (bottom of each panel). The four morpholino cocktail was injected at the “medium” dose, and an equivalent dosage of morpholino (ng) was injected in control animals. Panels show whole mount in situ hybridization of the trunks of 24 hpf morpholino-injected animals probed for zebrafish fli1 (A), fli1b (B), ets1 (C), etsrp (D), flt4 (E), vecdn (F), flk1 (G), plxnd1 (H), efnb2 (I), gata1 (J), and gata2 (K). (L,M) Confocal images of the mid-trunk of 36 hpf control- (L) and four morpholino cocktail- (M) injected Tg(fli1:nEGFP)y7 animals, collected using identical microscope settings. (L) Control animals display numerous brightly EGFP-positive endothelial nuclei in both axial (arrowheads) and intersegmental (arrows) vessels. (M) Only a small number of residual moderately EGFP-positive cells are seen in the position of the axial vessel (arrows) in four morpholino-injected animals. Anterior is to the left in all images. Scale bar = 250 μm.
