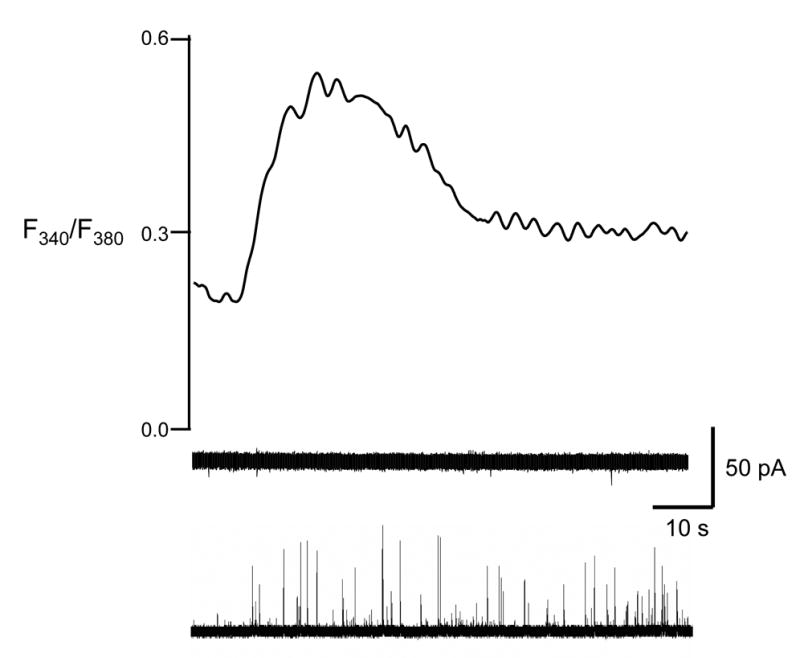
Figure 1. Amperometric and fura-2 signal traces in response to a transient application of CCCP.

A 3-s application of 2 μM CCCP caused Ca2+ elevation (top). In 8 out of 10 cells, no release was observed (middle). In 2 out of 10 cells, the elevated Ca2+ concentration was sufficient to evoke amperometric release (bottom). The right y-axis corresponds to the upper trace while the scale on the left corresponds to both amperometric traces. Cells were maintained in Ca2+-free buffer.
