
Figure 2. Amperometric and fura-2 signal traces in the presence and absence of the protonophore, CCCP.
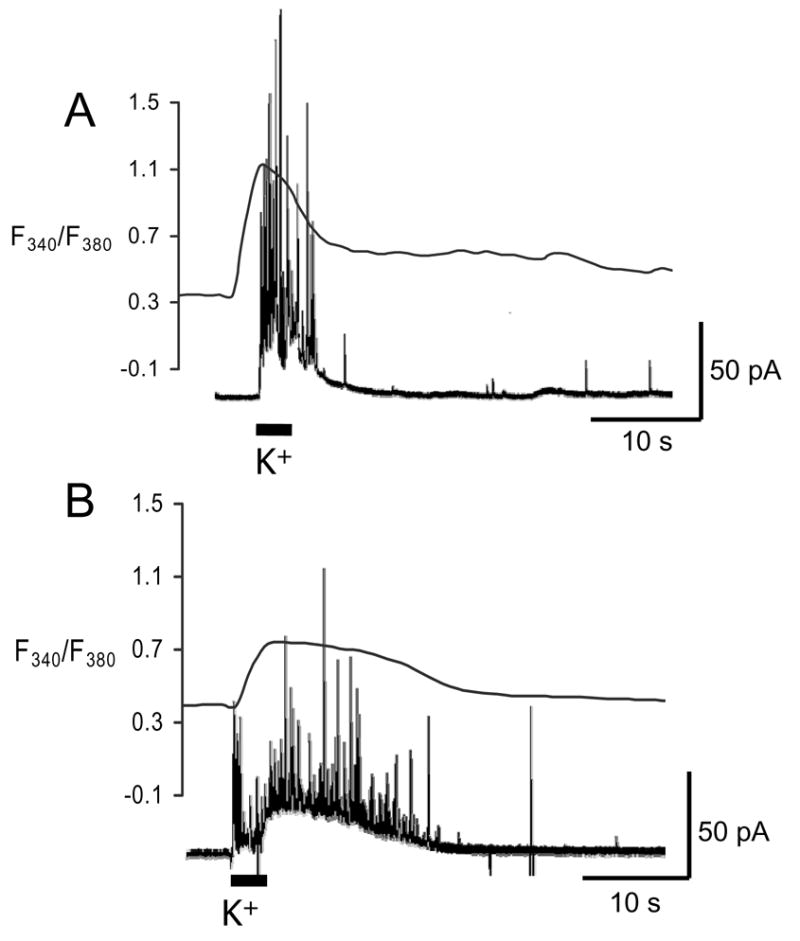
Each cell was exposed to a 3-s pressure ejection of 60 mM K+ in Ca2+ containing buffer. Overlays of representative amperometric (left y-axis) and fura-2 (right y-axis) traces for A) untreated cells and B) treated cells. Exposure to CCCP increased both the release duration and the width at half-maximal height of the fura-2 signal.