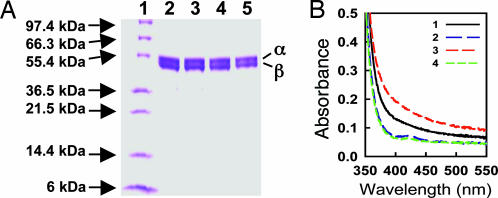
Fig. 1.
Protein purification and visible region absorption spectroscopy. (A) Coomassie blue-stained 10–20% gradient SDS/PAGE of NifEN, ΔnifB NifEN, NifENcomplete and ΔnifB NifENcomplete. Lane 1, 10 μg protein standard; lane 2, 15 μg purified NifEN; lane 3, 15 μg of purified ΔnifB NifEN; lane 4, 15 μg of purified NifENcomplete; lane 5, 15 μg of purified ΔnifB NifENcomplete. (B) Visible region spectra of the same protein samples in A. Spectra of dithionite-reduced NifEN (1), ΔnifB NifEN (2), NifENcomplete (3), and ΔnifB NifENcomplete (4) are shown between 350 and 550 nm. The samples were prepared at a concentration of 5 mg/ml, as described in Supporting Text, which is published as supporting information on the PNAS web site.

