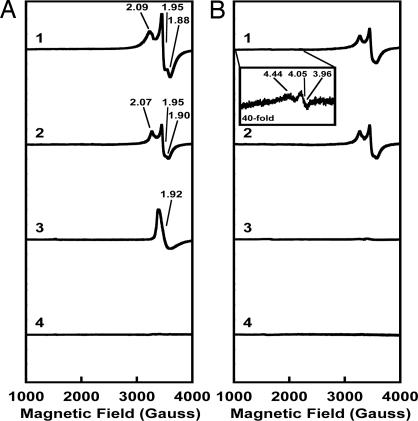
Fig. 2.
EPR spectra of unprocessed (A) and processed (B) NifEN and ΔnifB NifEN. (A) EPR Spectra of dithionite-reduced NifEN (1), dithionite-reduced ΔnifB NifEN (2), IDS-oxidized NifEN (3), and IDS-oxidized ΔnifB NifEN (4). (B) EPR Spectra of dithionite-reduced NifENcomplete (1), dithionite-reduced ΔnifB NifENcomplete (2), IDS-oxidized NifENcomplete (3), and IDS-oxidized ΔnifB NifENcomplete (4). All spectra were measured at a protein concentration of 15 mg/ml, as described in the Supporting Text. The g values are indicated. (Inset) The spectrum of dithionite-reduced NifENcomplete between 1,000 and 2,000 G at a magnification of 40-fold.

