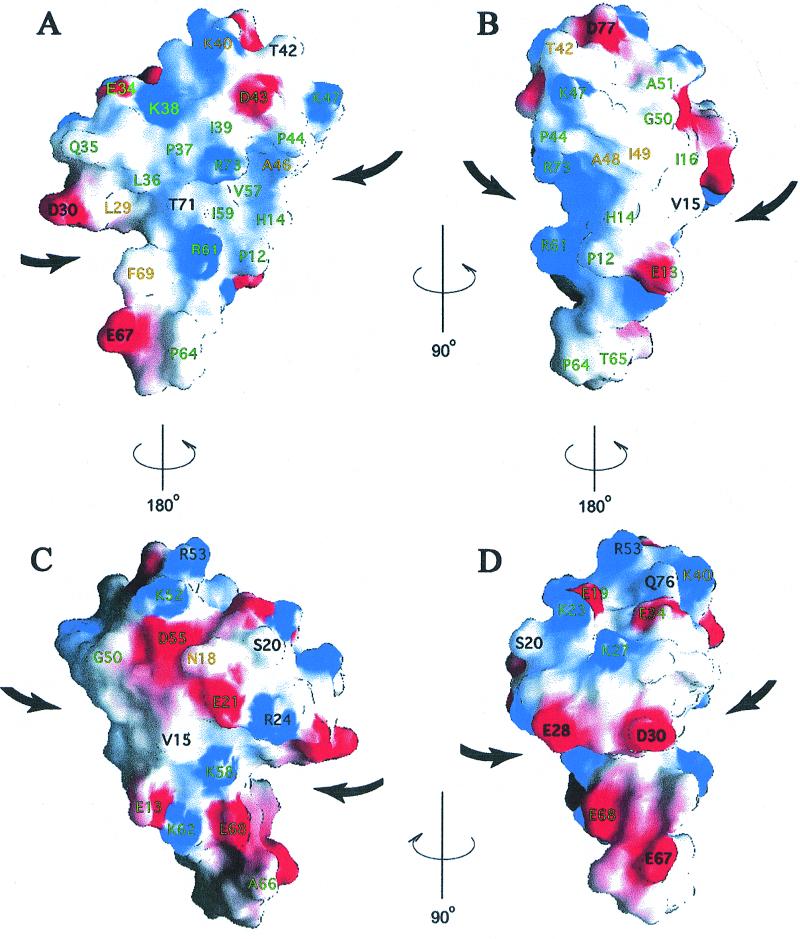
Figure 4.
Four views of the surface charge distribution calculated and drawn by using grasp (34), with red representing negative potential (−6.2 kT, full intensity) and blue positive potential (7.6 kT, full intensity). Conserved residues are labeled according to the color scheme in Fig. 1. A is in the same orientation as Fig. 2.

