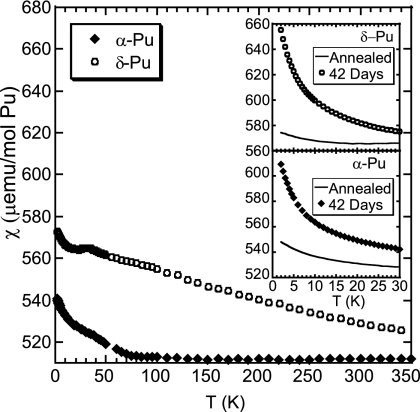
Fig. 1.
χ(T) for annealed α-Pu and stabilized δ-Pu(4.3 at. % Ga). The Curie tail in α-Pu is consistent with ≈200 ppm Fe impurities, whereas the gentle slope in δ-Pu may arise from small quantities of PuGax (2 ≤ x ≤ 3) second phases. (Inset) The low temperature χ(T) for annealed specimens and after aging the specimens for 42 days at or below 30 K.

