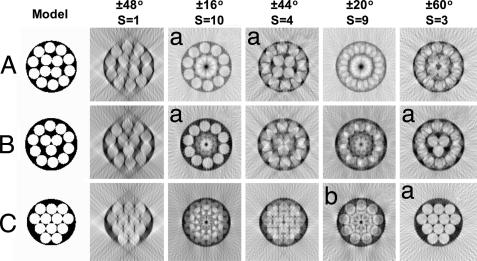
Fig. 4.
Simulated r-weighted back projection with rotational symmetry on test models. Shown are test models containing 14 (A), 13 (B), and 12 (C) microfibrils. Computed reconstructions for different angular ranges and rotational symmetry values (S) are as indicated. The angular sampling interval is 4° in all simulations. The simulations show that inappropriate values of S for each model do not generate meaningful reconstructions. The reconstructions with appropriate S values are marked with an a. The outer core of model C is, however, close enough to a 9-fold rotational symmetry to yield an interpretable S = 9 reconstruction (indicated by b).

