Fig. 4.
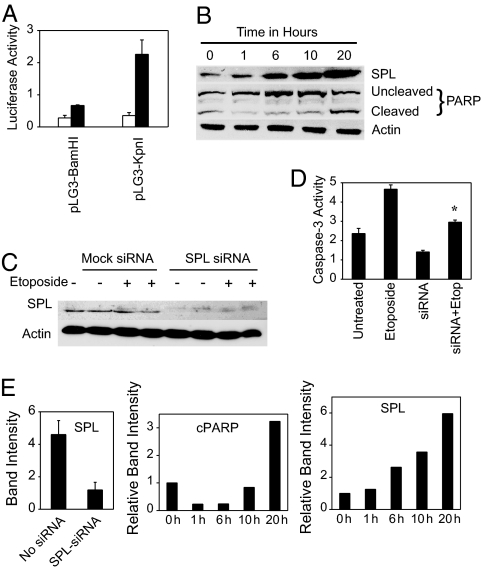
Role of endogenous SPL in apoptosis. (A) HEK293 cells were transiently transfected with SPL reporter constructs pLG3BamHI and pLG3KpnI (containing ≈8 and ≈2 kb of promoter length, respectively) and treated for 24 h with vehicle (white bars) or 12.5 μM etoposide (black bars), and SPL gene expression was determined by luciferase assay. (B) HEK293 cells were treated with 12.5 μM etoposide and harvested at various time points. SPL expression and PARP cleavage were determined in whole-cell extracts by immunoblotting. Actin served as a loading control. (C) HEK293 cells were transfected with SPL siRNA or mock-transfected, then treated with etoposide for 48 h. SPL protein expression was determined in whole-cell extracts. (D) Caspase-3 activity was measured in the same extracts. ∗, P < 0.025, for etoposide-treated versus etoposide-treated plus SPL siRNA. (E) Quantitative analysis of autoradiogram band intensities for SPL and cleaved PARP (cPARP). For the etoposide induction experiment, SPL and cleaved PARP band intensities are given relative to time 0.

