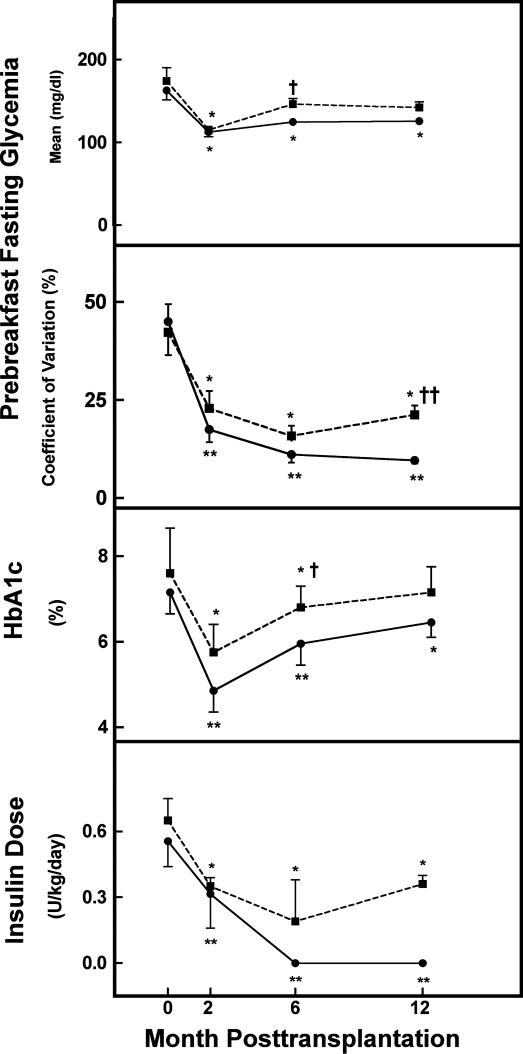
Fig. 3.
Longitudinal follow-up of mean and CVgl, HbA1c, and daily insulin dose in the 18 type 1 diabetic patients with 1 year surviving grafts. Patients are divided in two groups according to their state of insulin (in)dependence at PT month 12: n = 10 insulin-independent (solid line) and n = 8 insulin-dependent (dashed line) patients. Data are means ± SEM. Statistical difference versus pretransplantation: ∗, P < 0.01; ∗∗, P < 0.001. Statistical difference between groups: †, P < 0.01; ††, P < 0.001.

