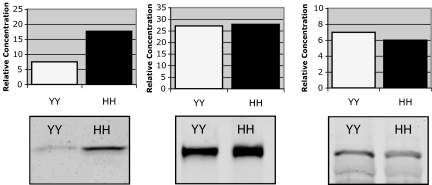
Fig. 2.
Quantitative immunoblot analysis of CRP (Left), CFH (Center), and C5 (Right) in the RPE–choroid of 402YY and 402HH donors. Individual lanes were loaded with 20 μg of total protein, and relative concentrations were calculated by extrapolating against a standard curve generated from lanes loaded with 1 ng, 5 ng, and 25 ng of CRP, CFH, or C5 control protein. Histograms represent the average of two donors from each genotype. Both HH donors used in this analysis were diagnosed with AMD, and one of the two YY donors had been diagnosed with AMD.

