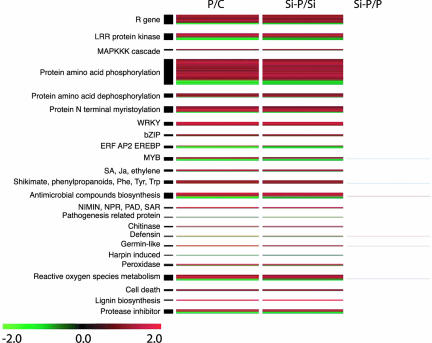
Fig. 3.
Differentially expressed genes in Arabidopsis leaves and related to defense reactions and associated expression profiles. The columns represent some contrasts between the treatments: control (C), silicon (Si), E. cichoracearum (P), or a combination of both (Si-P). Among regulated genes, 616 were classified as plant defense-related. Each one of these genes (P < 0.01, ≥1.5-fold change) in at least one contrast is represented by a colored line indicating the mean relative transcript level (n = 6): green corresponds to a log2 ratio of −2 (down-regulation), and red corresponds to a log2 ratio of 2 (up-regulation).

