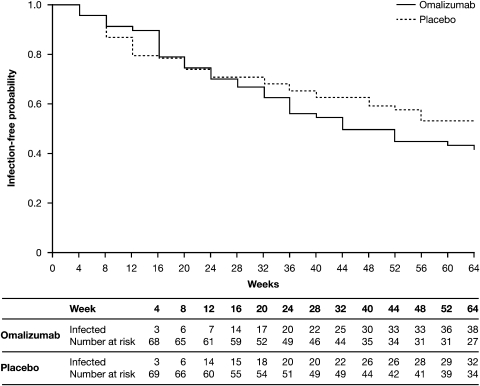
Fig. 3.
Kaplan–Meier plot of time to first detection of infection with intestinal helminth parasite during core and follow-up phases. These data include data for discontinued patients, so the number of patients infected in this analysis (36 vs. 29) differs slightly from the number of reported infections during the 52-week treatment period (34 vs. 28).

