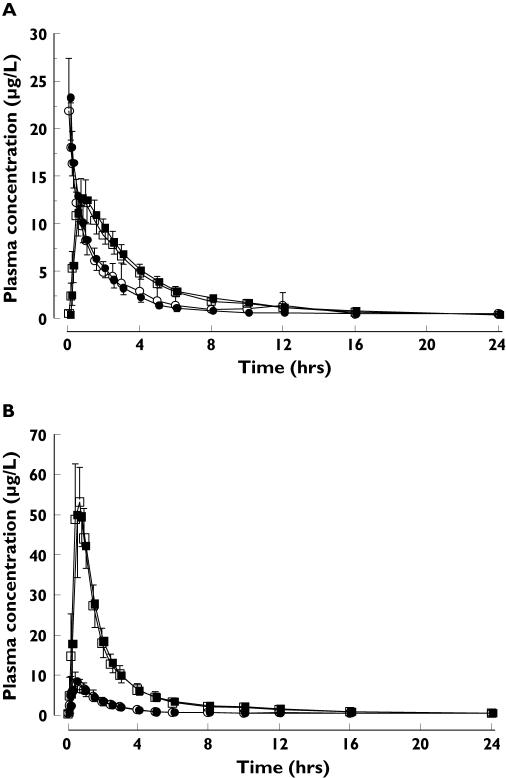
Figure 1.
Plasma concentration-time profiles (mean ± SD) of midazolam (○, •) and 1-hydroxy midazolam (□, ▪) after a single i.v. dose of 1 mg (A) and a single oral dose of 2 mg midazolam (B) administered alone (open symbols) and with roflumilast 500 µg dosed to steady-state (closed symbols); n = 18 healthy male subjects

