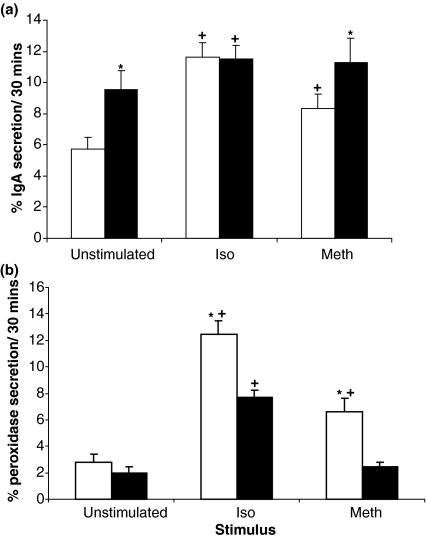
Figure 3.
Percentage IgA (a) and peroxidase (b) secretion from submandibular cell preparations of the unoperated control (white columns) and the contralateral gland that had previously been ligated for 24 h (black columns). The results are expressed as the mean ± SEM (n = 19 from four separate ligation experiments for IgA and n = 10 from two experiments for peroxidase) secreted as a percentage of the total present in cells and medium; *P < 0.05 compared with cells of the contralateral gland for the same treatment, +P < 0.05 compared with the unstimulated cells from the same gland.

