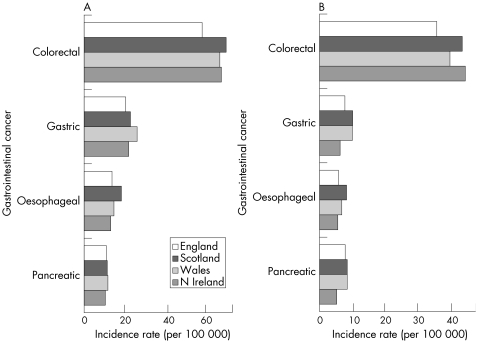
Figure 3.5.1 Standardised incidence rates (per 100 000 population) for colorectal, gastric, oesophageal, and pancreatic cancers in England, Scotland, Wales, and Northern Ireland, for the period 1993–2001. (A) For men; (B) for women. Notes: Incidence rates are directly standardised to the standard European population. Sources: England: National Cancer Intelligence Centre, Office for National Statistics; Scotland: Information and Statistics Division, NHS in Scotland; Wales: Welsh Cancer Surveillance and Intelligence unit; Northern Ireland: Northern Ireland Cancer Registry.215,454,455,456

An official website of the United States government
Here's how you know
Official websites use .gov
A
.gov website belongs to an official
government organization in the United States.
Secure .gov websites use HTTPS
A lock (
) or https:// means you've safely
connected to the .gov website. Share sensitive
information only on official, secure websites.
