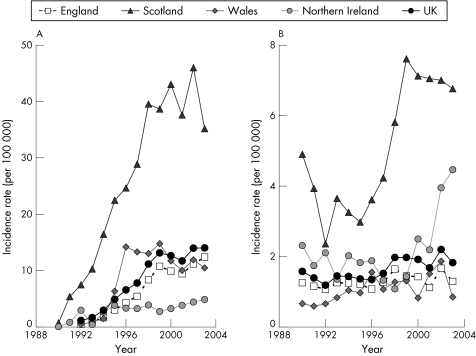
Figure 3.2.4 Trends in incidence rates (per 100 000 population) for reported hepatitis C and B infections in the UK, England, Scotland, Wales, and Northern Ireland, 1990–2003. (A) Hepatitis C infection; (B) hepatitis B infection. Notes: These incidence rates are based on reported laboratory diagnoses.229

An official website of the United States government
Here's how you know
Official websites use .gov
A
.gov website belongs to an official
government organization in the United States.
Secure .gov websites use HTTPS
A lock (
) or https:// means you've safely
connected to the .gov website. Share sensitive
information only on official, secure websites.
