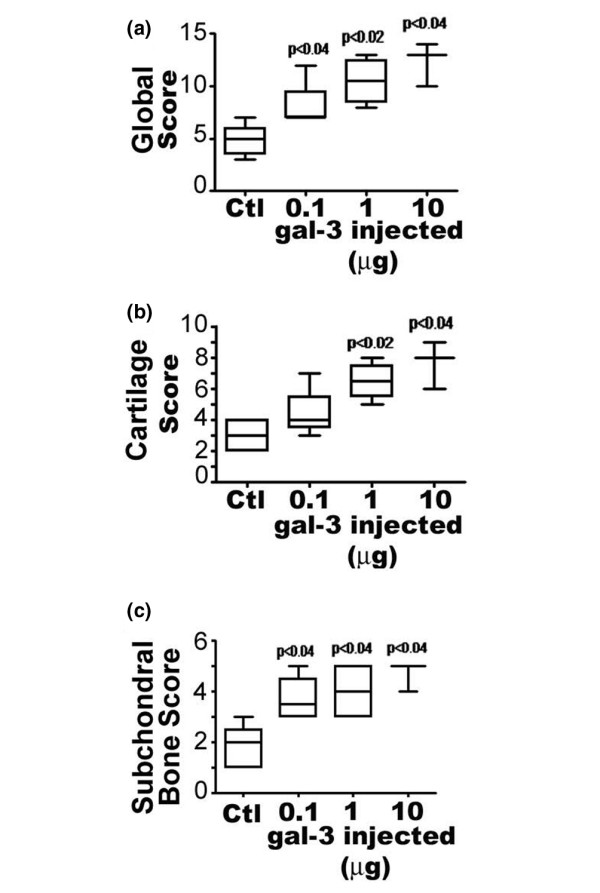
Figure 2.

Histological score for mice four days after intra-articular galectin-3 (gal-3) injection. (a) Total score, (b) cartilage score and (c) bone histomorphometric score. Data are expressed as median and (range) and are presented in box plot, where the boxes represent the 1st and 3rd quartiles, the line within the box represents the median, and the lines outside the box represent the spread of the values. Control (Ctl): mice injected with PBS. P versus control group; n = four animals per group.
