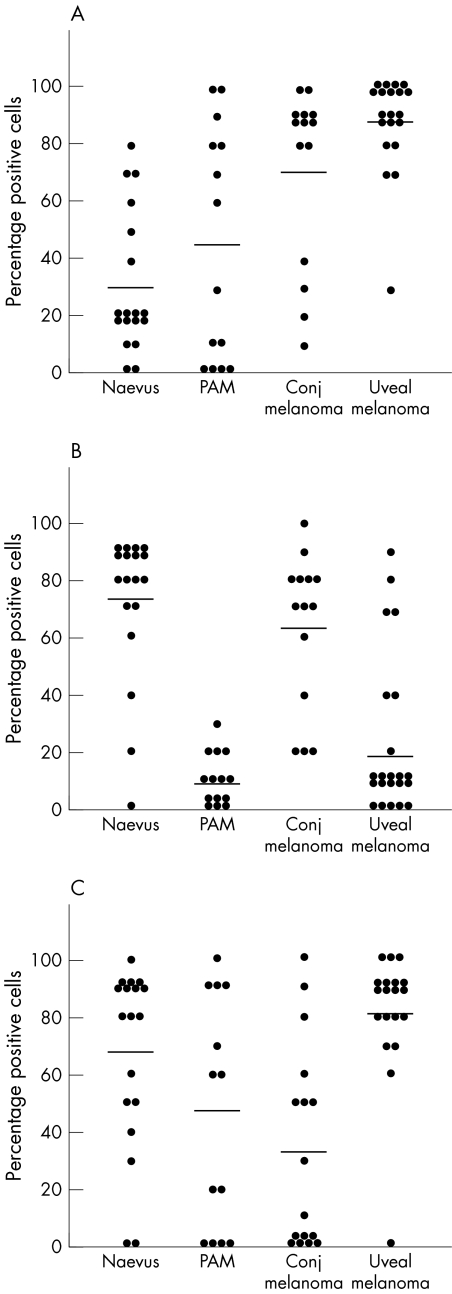
Figure 1 Percentage positive cells after staining for antibodies against S100A1 (A), S100B (B), and MelanA (C) in conjunctival naevus, PAM, conjunctival melanoma, and uveal melanoma specimens. Each dot represents a single case, the line represents the average score for each group of melanocytic lesions. (S100A1: naevus versus conjugated melanoma p = 0.001, Mann‐Whitney U test) (S100B: PAM versus naevus p<0.0001, PAM versus conjugated melanoma p<0.0001, conjugated melanoma versus uveal melanoma p<0.0001, Mann‐Whitney U test).

An official website of the United States government
Here's how you know
Official websites use .gov
A
.gov website belongs to an official
government organization in the United States.
Secure .gov websites use HTTPS
A lock (
) or https:// means you've safely
connected to the .gov website. Share sensitive
information only on official, secure websites.
