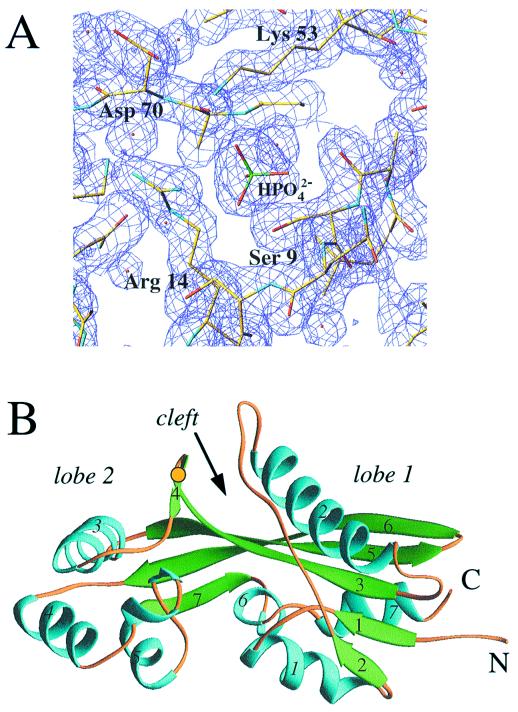
Figure 1.
(A) Final (2 Fo − Fc) electron density at 1.85 Å resolution [1σ level, drawn with turbo frodo (37)], depicting the phosphate ion bound at the Maf putative active site. Atoms of selected side chains are colored yellow, blue, and red for carbon, nitrogen, and oxygen, respectively, and oxygen atoms of water molecules are shown as small red spheres. (B) Overall structure of the Maf protein drawn with the program ribbons (38). The α helices and β strands are colored cyan and green, respectively, and are numbered. Loop regions are colored orange, N and C termini are labeled, and a yellow dot indicates the location of the disulfide bridge.

