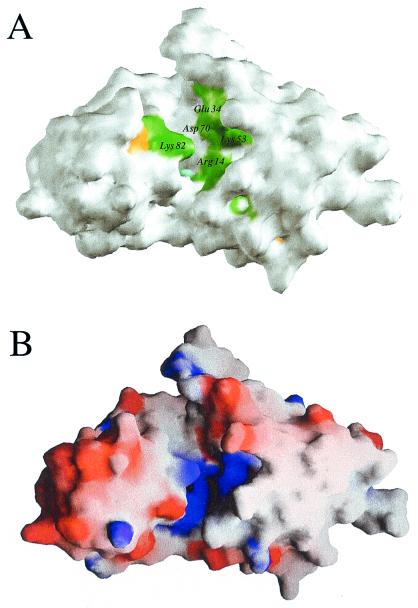
Figure 3.
(A) Arrangement of conserved residues on the 3D surface of Maf. Green, yellow, and cyan patches indicate the locations of amino acids that are conserved in 18 or more, in 17 or 16 of 19, and in 15 of 19 analyzed proteins, respectively (see Fig. 2). All other residues are white. (B) Electrostatic surface potential of Maf calculated with the program grasp (39). Blue and red patches indicate regions of positive and negative charge, respectively. The views in A and B are similar to that in Fig. 1B.

