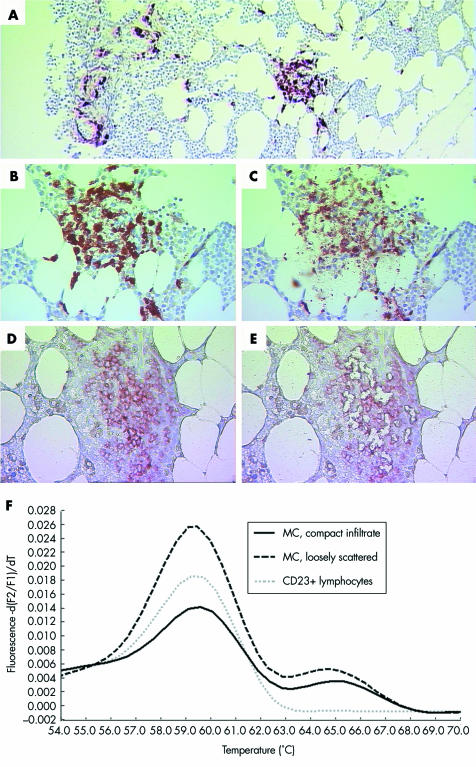
Figure 1 SM‐AHNMD (SM‐CLL) involving the bone marrow. (A) Anti‐MC tryptase (MCT) stained bone marrow section with a compact infiltrate (window) and loosely scattered MC (left). The compact MC infiltrate (B) before and (C) after laser microdissection of single MC. CLL infiltrate consisting of CD23 positive neoplastic lymphocytes (D) before and (E) after laser microdissection of single lymphocytes. (F) Melting point analysis of representative nested PCR products amplified from MC of compact (solid line) and loosely scattered (dashed black line) infiltrates, and from CD23 positive neoplastic lymphocytes of CLL infiltrates (dotted grey line). Wild type specific melting curves peak at ∼59.5°C, while D816V specific melting curves peak at ∼65°C. MC from both compact and loosely scattered infiltrates presented the D816V mutation heterozygously, while CD23 positive neoplastic lymphocytes in numerous experiments (n = 10) only showed the wild type. Original magnification: (A)×25; (B–E))×100.

An official website of the United States government
Here's how you know
Official websites use .gov
A
.gov website belongs to an official
government organization in the United States.
Secure .gov websites use HTTPS
A lock (
) or https:// means you've safely
connected to the .gov website. Share sensitive
information only on official, secure websites.
