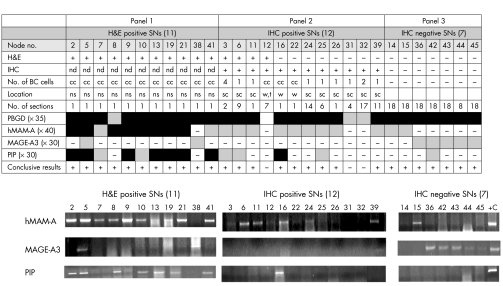
Figure 2 Expression profile of HMAM‐A, MAGE‐A3, and PIP on 30 SNs. Haematoxylin and eosin staining and immunohistochemical (IHC) analyses were carried out on 30 SNs as described in the text. Results were categorised as either haematoxylin and eosin positive (panel 1), IHC positive (panel 2), or IHC negative (panel 3). The number of breast cancer cells detected on an IHC section, the location of the BC cells, and the number of sections performed in order to obtain a positive IHC result is indicated in appropriate columns. PCR cycle numbers for each marker are indicated in brackets. Black and grey boxes represent strong and weak expression of markers respectively. Each marker was tested once in three independent experiments and the PCR result was scored as “positive” if at least two out of three results were positive. cc, cell clusters; sc, subcapsular sinus; w, within lymphoid tissue; t, trabeculae; nd, not determined; ns, not specified.

An official website of the United States government
Here's how you know
Official websites use .gov
A
.gov website belongs to an official
government organization in the United States.
Secure .gov websites use HTTPS
A lock (
) or https:// means you've safely
connected to the .gov website. Share sensitive
information only on official, secure websites.
