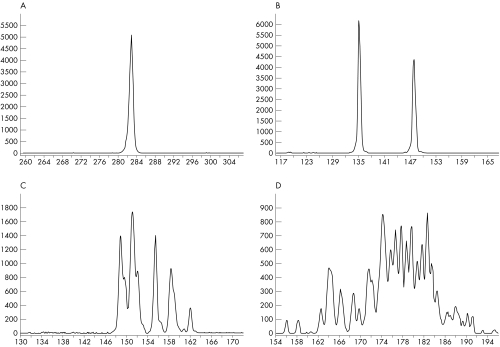
Figure 2 T cell receptor γ (TCRγ) gene rearrangements. Electrophoretic profiles of PCR products of the TCRγ gene using DNA extracted from T cell lymphomas (frozen tissue). (A) A monoclonal (monoallelic) pattern is present as a single peak at 282 bp. (Vγ1–8 primer and a mixture of Jγ primers). (B) A monoclonal (biallelic) pattern is shown as two peaks at 148 bp and 135 bp, respectively. (Vγ11 primer and a mixture of Jγ primers). (C) An oligoclonal pattern. (Vγ10 primer and a mixture of Jγ primers) and in (D) a polyclonal pattern. (Vγ9 primer and a mixture of Jγ primers). In (C) and (D), each peak corresponds to the amplification of rearrangements from different clones, sharing the same V and J regions but having distinct junctional sequences. The y axes indicate the relative fluorescence intensities and the x axes the size (bp) of the PCR products.

An official website of the United States government
Here's how you know
Official websites use .gov
A
.gov website belongs to an official
government organization in the United States.
Secure .gov websites use HTTPS
A lock (
) or https:// means you've safely
connected to the .gov website. Share sensitive
information only on official, secure websites.
