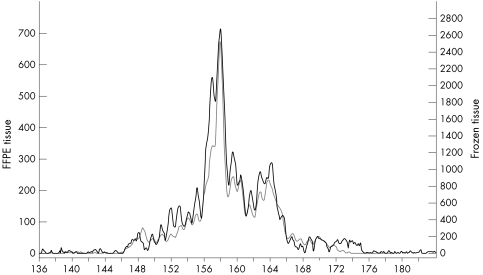
Figure 3 Monoclonal peaks superimposed on a polyclonal cell background. Electrophoretic profiles of PCR products of the T cell receptor γ chain gene using DNA from a T cell lymphoma. The profiles from frozen (grey line) and FFPE (black line) tissue are placed on top of each other showing identical patterns. (Vγ10 primer and a mixture of Jγ primers). The y axis indicates the relative fluorescence intensities and the x axis the size (bp) of the PCR products.

An official website of the United States government
Here's how you know
Official websites use .gov
A
.gov website belongs to an official
government organization in the United States.
Secure .gov websites use HTTPS
A lock (
) or https:// means you've safely
connected to the .gov website. Share sensitive
information only on official, secure websites.
