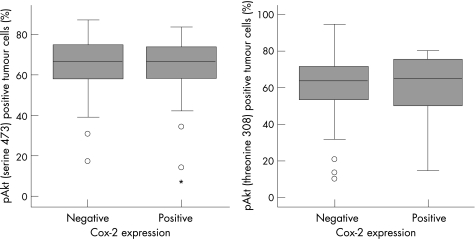
Figure 3 Box plots showing the relationship between cyclo‐oxygenase‐2 (COX‐2) immunoexpression and the percentage of phospho‐Akt (pAkt; serine 473 and threonine 308) positively stained tumour nuclei. Tumours with or without COX‐2 expression exhibited equal amounts of pAkt tumour cells independent of the phosphorylation site. Open circles indicate outliers; asterisks indicate extreme values. Data were available for 95 cases (pAkt threonine 308) and for 113 cases (pAkt serine 473).

An official website of the United States government
Here's how you know
Official websites use .gov
A
.gov website belongs to an official
government organization in the United States.
Secure .gov websites use HTTPS
A lock (
) or https:// means you've safely
connected to the .gov website. Share sensitive
information only on official, secure websites.
