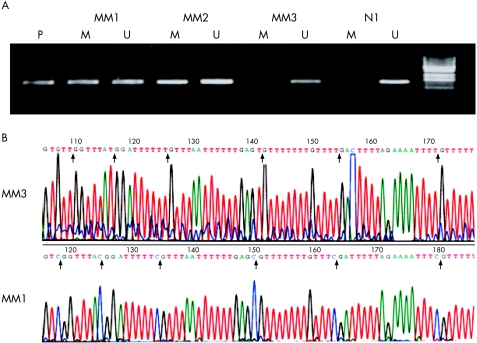
Figure 3 (A) Representative methylation‐specific polymerase chain reaction analysis of samples from patients with multiple myeloma. (B) Partial sequence data obtained from bisulphite genomic sequencing; M, amplified products with primers recognising the methylated gene sequence; MM1, MM2, MM3, myeloma samples; N, normal bone marrow sample; P, positive control; U, amplified products with primers recognising the unmethylated gene sequence. Vertical arrows indicate the positions of cytosine on cytosine‐deoxyribose phosphates followed immediately by a guanine‐deoxyribose phosphate (CpG). Upper column, all cytosines are converted to thymidine by bisulphite treatment in MM3, indicating that it was unmethylated. Lower column, all cytosines on seven CpG sites remained unchanged in MM1, which was methylated.

An official website of the United States government
Here's how you know
Official websites use .gov
A
.gov website belongs to an official
government organization in the United States.
Secure .gov websites use HTTPS
A lock (
) or https:// means you've safely
connected to the .gov website. Share sensitive
information only on official, secure websites.
