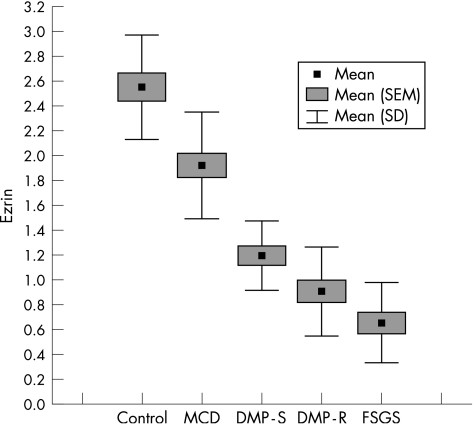
Figure 2 Box plot distribution of data for ezrin expression by the percentage of glomerular area in the control and study groups. DMP‐R, diffuse mesengial proliferation‐resistant; DMP‐S, diffuse mesengial proliferation‐sensitivity; FSGS, focal segmental glomerulosclerosis; MCD, minimal change disease.

An official website of the United States government
Here's how you know
Official websites use .gov
A
.gov website belongs to an official
government organization in the United States.
Secure .gov websites use HTTPS
A lock (
) or https:// means you've safely
connected to the .gov website. Share sensitive
information only on official, secure websites.
