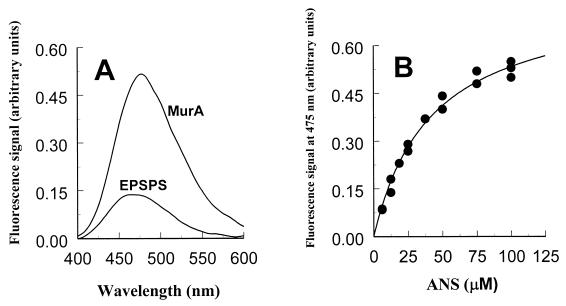
Figure 1.
ANS-dependent fluorescence response in MurA and EPSP synthase. (A) Comparison of the fluorescence spectra of MurA and EPSP synthase at 75 μM ANS. The protein concentration was 3 μM. (B) Fluorescence signals of MurA as a function of the ANS concentration. The dissociation constant of ANS in its reaction with free MurA was determined by fitting the data to y = ymax* [ANS]/(Kd + [ANS]).

