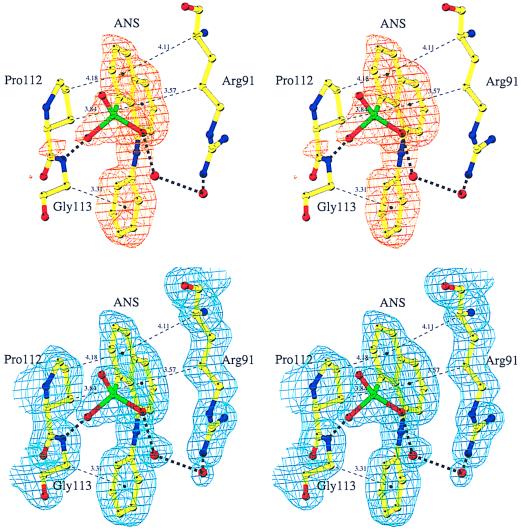
Figure 3.
The ANS binding site in MurA. (Upper) Representation of the Fo−Fc difference density contoured at 3 σ in the region of the ANS binding site. ANS was omitted in the refinement and the calculation of the Fourier synthesis. (Lower) The final 2Fo−Fc electron density contoured at 1 σ. ANS was included in the refinement and the calculation of the Fourier synthesis. Carbon atoms are colored yellow, nitrogen atoms blue, oxygen atoms red, sulfur atoms green. Solvent molecules are shown as red spheres. Thick dashed lines represent hydrogen bonds. To designate hydrophobic interactions, distances between ring centers and closest carbon atoms are given along thin dashed lines. The figure was drawn with bobscript (22).

