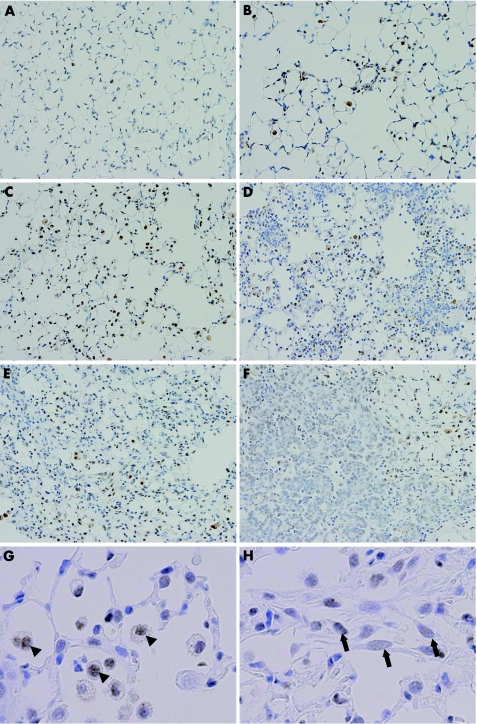
Figure 3 Time‐course changes of Smad3 localisation in bleomycin‐induced pulmonary fibrosis. Representative immunohistochemical results for Smad3 for the saline‐treated group on day 9 (A) and for the bleomycin‐treated group on days 2, 5, 7, 9 and 14 after intranasal injection (B, C, D, E and F, respectively). Higher‐magnification views of specimens from bleomycin‐treated mice on day 9 (G,H). (A) In the vehicle group, positive signals for Smad3 were sparsely observed on a small number of bronchial epithelial cells and alveolar macrophages. (B–D) On days 2–7, positive signals for Smad3 were observed preferentially on infiltrating macrophages and some type II alveolar epithelial cells. Smad3‐positive signals were exclusively localised to the nucleus. The cellularity of Smad3‐positive macrophages progressively increased along with an increase in macrophage infiltration. (E) On day 9, the numbers of nuclear Smad3‐positive macrophages and type II epithelial cells were still high. Positive signals for Smad3 were observed weakly on the nucleus of proliferating fibroblasts in fibroblastic foci. (F) On day 14, weakly positive signals for Smad3 were observed on hyperplastic alveolar/bronchiolar epithelial cells. (G) A higher magnification image on day 9. Arrowheads indicate Smad3‐positive signals on macrophages. Note the intense Smad3‐positive signals observed in the nucleus of infiltrating macrophages. (H) A higher magnification image on day 9. Arrows indicate Smad3‐positive signals on fibroblasts. Note the faint Smad3‐positive signals observed in the nucleus of fibroblasts in fibroblastic foci, ×400.

An official website of the United States government
Here's how you know
Official websites use .gov
A
.gov website belongs to an official
government organization in the United States.
Secure .gov websites use HTTPS
A lock (
) or https:// means you've safely
connected to the .gov website. Share sensitive
information only on official, secure websites.
